

To make the library more comfortable to use, we are conducting a pilot test of a visualization service that provides real‑time and easy‑to‑understand congestion information.
This project is developed and operated primarily by student fellows at TGIF (Town & Gown Future Innovation Institute).
How does it work?
Small computers (ESP32 devices) installed inside the library receive the number of Bluetooth signals emitted by smartphones and other devices. The system estimates the level of congestion based on how many signals are detected.
- We do not collect any information that can identify individuals.
- MAC addresses are random strings and do not contain any personal information.
- If you turn off Bluetooth, your device will not be counted.
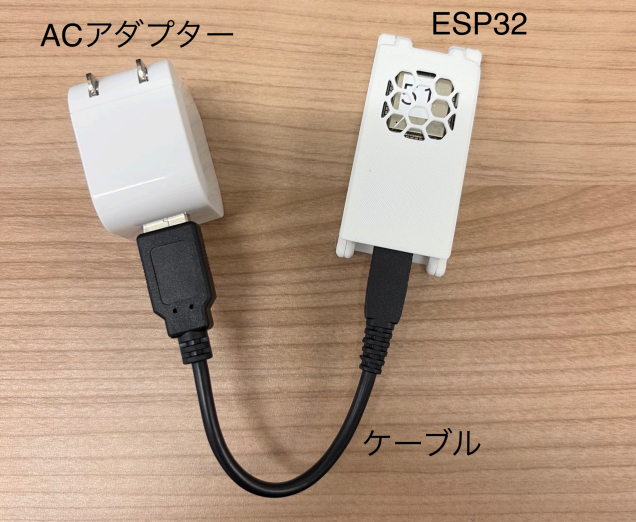
The ESP32 device (small computer) on the right collects the data.
When using BIBLA, please do not touch the device or unplug it from the outlet.
The system only counts Bluetooth signals from smartphones and other devices, so no personal information can be identified. You can use the library with confidence.
Looking Ahead
Visualizing congestion levels is a new initiative designed to make the library easier and more comfortable to use.
Moving forward, TGIF Student Fellows will continue leading research and development efforts to improve the learning environment across campus.
Expansion to BIBLA West / East
Although the system is currently being tested in the Central Library, we plan to introduce the same mechanism in BIBLA West and BIBLA East in the future. Our goal is to create an environment where congestion levels can be checked across the entire campus.
By reducing the time students spend wondering “Which space is open right now?” between classes, we hope to make it easier and smoother for everyone to find suitable study spaces.
Displaying Congestion Levels in the TGO App
We plan to make real‑time congestion information available in the TGO app in the future. (Currently, only the cafeteria congestion service is provided.)
※For more details about the Cafeteria Congestion Visualization Service, please click here.: about the Cafeteria Congestion Visualization Service
- Library Congestion Level
- Estimated Available Seats
- Opening Hours & Floor Information
Being able to check this information quickly through the app will reduce the stress of “I went there, and it was full…” and help students use the learning environment more comfortably.
Improving Accuracy with Position Estimation Using Bluetooth Signal Strength
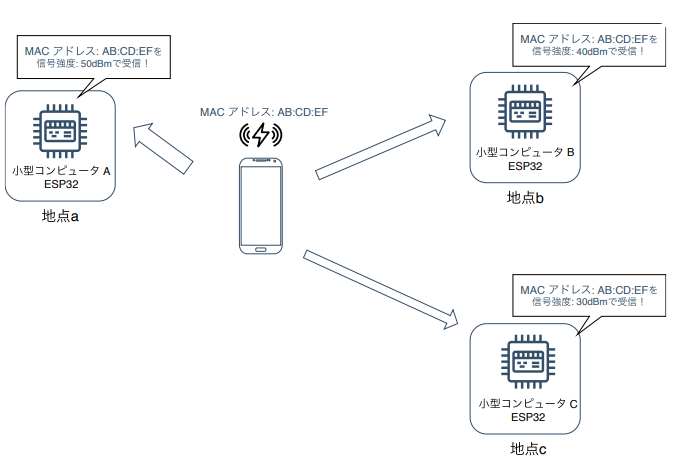
In the current system, devices located outside the library may still be detected if they are within Bluetooth range. To address this, we are working on a technique that estimates a device’s approximate position by combining the Bluetooth signal strengths received by multiple ESP32 units (as shown in the left figure).
To further reduce signal variability, we apply machine learning to correct noise and improve the accuracy of the estimated location. This enables more precise identification of devices that are actually inside the library.
Would you like to read this article as well?
① You can view reports written by actual users in the “Student Reports” section on the TGO website.:https://tgo.hiroshima-u.ac.jp/congestion-visualization-service-report/
② You can read comments from the students involved in the development in the “Student Interviews” section on the TGO website.: https://tgo.hiroshima-u.ac.jp/congestion-visualization-service-interview/